Local news for every place you call home
A six-month research program I planned and ran for the next Spectrum News app. It showed that people follow news for every place they call home, and it set the app's feature priorities and the order it rolled out to devices.
Following more than one location became the app's biggest differentiator.
Present as slides →The problem
Charter wanted to build the next Spectrum News app, one experience across phone, iPad and connected TV, but didn’t yet know what it should be. I was brought in to do the research that would give the team its direction.
The app had launched in July 2020, and Charter saw the next version as an opportunity more than a problem to fix. Its market research showed people trust local news more than national news, and Charter owned a large network of local newsrooms that didn’t yet add up to one product. This was the height of the pandemic, people were living online, and trust in national news was low after the 2020 election.
The prototypes’ onboarding asked for one ZIP code and showed news for that place only. There was no research brief and no definition of success. The PM’s ask was close to “go do greenfield research and tell us what we should build.”
My role and the team
I planned and ran the research as the product team’s UX researcher on a six-month contract, from May to October 2021, working most closely with the PM, the design manager and the engineering manager.
I was part of a 14-person research team that ran hub and spoke, so I had peers to check plans with.
Before writing a plan, I did one-on-ones with the team to hear what each person thought we were building, read the marketing and planning materials, and reviewed the prototype. Then I ran a workshop where the team listed every question they had, grouped them, and voted on which answers would change their work most. Many of the questions were about which features to build first and which device to build for first. That question bank became a research plan in phases, each one feeding the next.
The approach
I started with interviews to learn how people actually watch news, sized what I heard with a survey of about 2,000 people, and tested designs as they took shape.
Interviews: 10 people, about an hour each. I recruited through UserTesting with a screener built on behavior, not demographics: people who watch or listen to local news often. I wrote it so it was hard to game, because people are paid to qualify and some will click anything. It was 2021, so sessions were remote. Participants walked me through a normal day, and whenever they said where they sat, I asked them to photograph it, then photograph the TV from that spot. That showed me things people don’t think to say, like a TV that sits behind someone’s desk all day. Remote sessions turned out to have an upside: participants came from across the US instead of one city. Team members watched live and sent me follow-up questions in a Slack channel during the sessions.
Synthesis. I rewatched every session, logged notes and quotes by participant against the script, and affinity mapped them. With 10 people I reported findings as most, some or none rather than percentages, and presented them as direction, enough to start designing but not enough to commit, with the survey as the next step to size them.
Survey: about 2,000 respondents. I built a survey of more than 25 questions in SurveyMonkey, and a panel vendor collected the responses from local news consumers across the US. Most answer options came from the interviews, which surfaced choices we wouldn’t have listed ourselves, like the car radio as a news channel. For features, people picked the ones they’d want and then ranked their picks. That gave each feature two numbers, how many people wanted it and how high they ranked it, so we could tell a feature most people liked apart from one a smaller group couldn’t live without. I analyzed it by hand, slicing the results by age, socioeconomic group and other profiles.
Usability testing. Once the interviews gave designers enough to work with, I tested their prototypes, usually with about 10 people per prototype, comparing versions and feeding results straight back to design.
Taxonomy. The app pulled stories from many newsrooms, and each journalist made up tags as they filed. The same subject arrived as COVID, COVID-19 and coronavirus. I studied the existing tags and planned research on how journalists would tag the same story, and worked with designers on an internal tool that could cluster similar tags. I left before that work finished.
What we learned
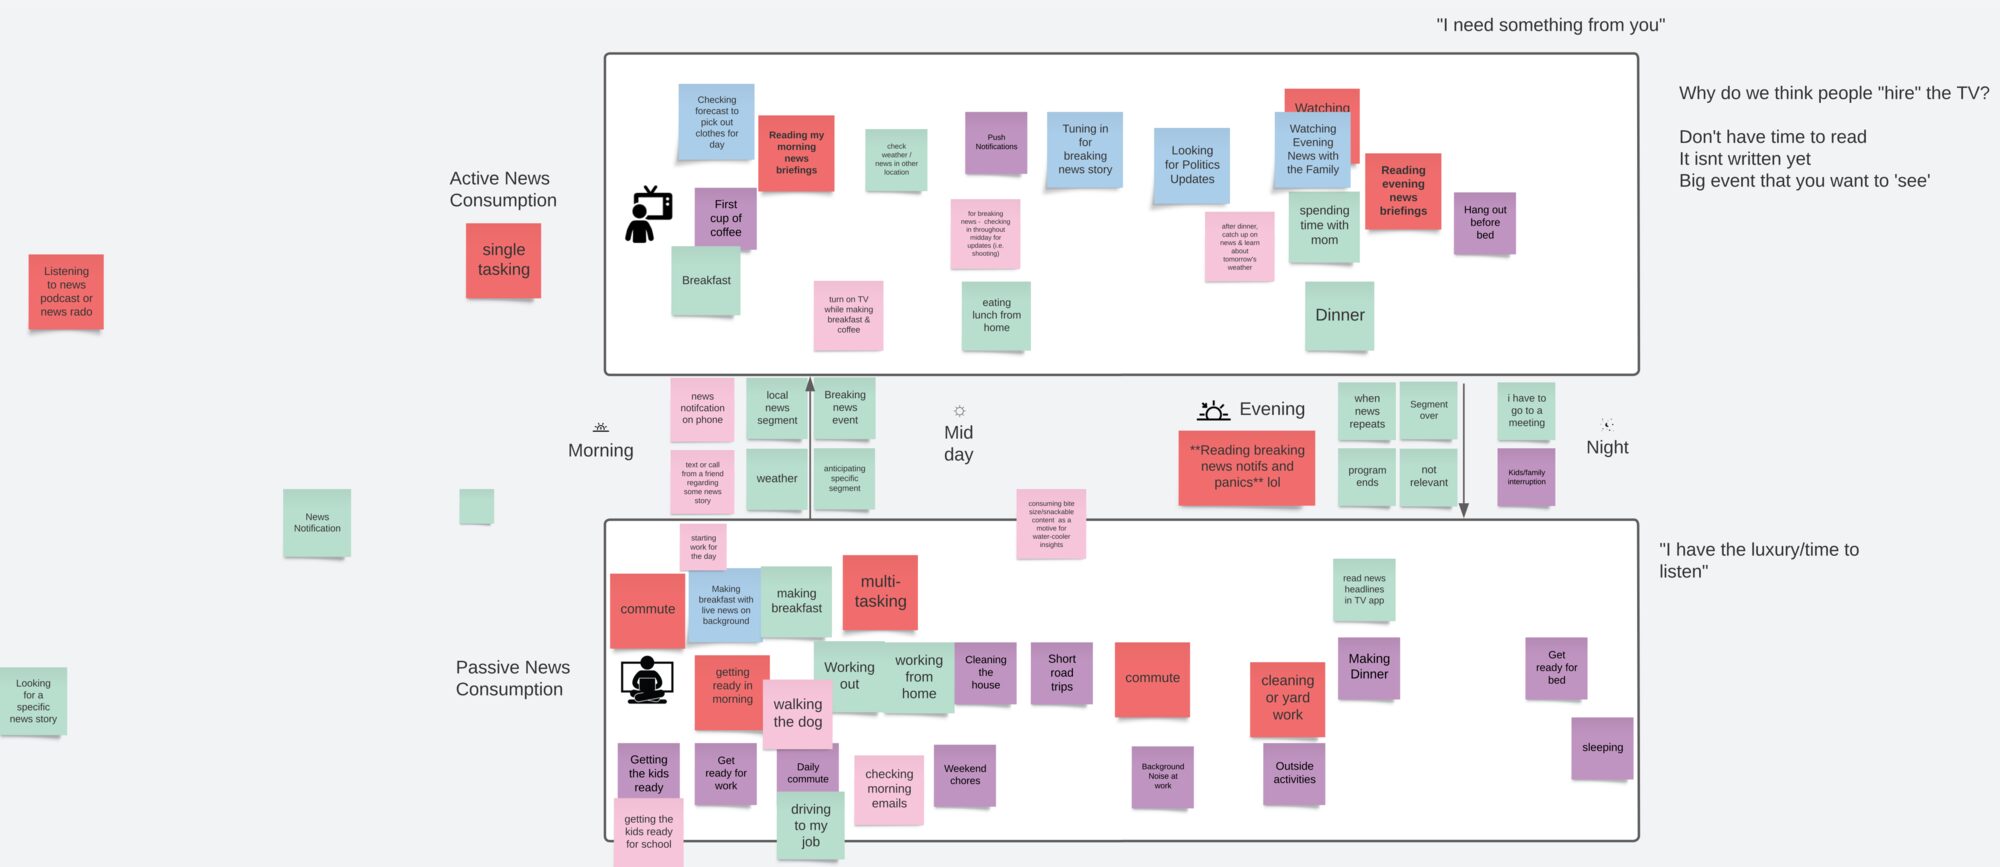
Most people follow news for places they don’t live. And they watch in two modes: in the background most of the time, then fully focused when a story catches them.
The places people follow are part of who they are. Most participants followed local news for somewhere they didn’t live. One woman in Seattle showed me the apps on her TV: one for a Texas city where her family lives, so she’d know if a hurricane hit, and one for New York, where she used to live. Others followed the town they went to college in or a place they’d spent years. Asking for one ZIP code at onboarding would have left all of those places out. The survey confirmed demand for following more than one place.
People watch news in two modes, and switch between them. Most of the time the news was on in the background, in another room or behind them while they worked, for company, for noise or out of habit. When a story caught them, often a natural disaster, they’d drop what they were doing and give it full attention, then drift back. “I always thought of it as like fishing,” waiting until something’s on the hook. Watching as a ritual, like the evening news with family, happened but was less common. I mapped these as modes of watching rather than personas, because the same person moves between them during a day.
Which devices people use for news. The survey ranked devices for news, which gave the team a way to decide where to build first.
What changed
The team had assumed local news meant one location per person. The research showed people follow local news for several places they’re connected to through their own lives and their families, so onboarding let people follow more than one place. The research also set feature priorities and the order to build for devices.
Onboarding stopped locking people to one place. Following several locations became part of the app, and it’s the change I’m surest came from this work.
The roadmap. The research set feature priorities and the order to build for devices with the PM, who owned the roadmap. Tickets for features and devices came straight out of the readouts, and the findings heavily informed the roadmap for the next two years. The two modes also raised design questions the team worked through, such as whether video should autoplay, how a blended feed from several places should play in the background, and whether the app should keep playing audio with the screen off.
Readouts. I gave two or three large readouts (the interviews, the survey and a combined synthesis) and about five shorter usability readouts, live, with video clips. They went to the product team of 15 to 25 people, plus directors.
Charter launched its connected-TV app for Roku and Apple TV in September 2022. Charter’s numbers since:
- +146% year-over-year connected-TV growth in 2024.
- 5M unique mobile visitors to the app since its 2020 launch.
For context on the app itself: it passed 1M downloads in March 2021, before my contract began, and outperformed CNN, Fox News and MSNBC in local markets in December 2021. Charter published all of these figures.
Looking back
I didn’t track which recommendations shipped after each readout, so beyond the onboarding change I can’t say feature by feature what the team built from it. I saw my job as making findings clear enough for the team to weigh the trade-offs, and I moved on to the next study instead of following each one.
The tagging work needed more research than I had time for. Today I’d use a language model to cluster the existing tags first, then take the clusters to journalists.
This was also the first time I had a product team, a budget and the freedom to plan research from the start, after support operations work at LogMeIn with a much smaller budget.